Your cart is empty.
shop now
Your cart is empty.
shop now
1.Experimental part
1.1 Raw material
Ammonia ester modified liquefied MDI (U-MDI ), NCO%=28.4 %, functionality 2, ethylene oxide terminated polypropylene oxide polyether (PPO), ZS-2185, Mn=2000, [K+]<5ppm, primary hydroxyl content>70% in DETDA, 2,4-isomer/2,6-isomer=80/20. MDA and catalyst dibutyltin dilaurate are chemical reagents, catalyst dosage: 2.0×10⁻¹g cat./g PPO.
1.2 Sample preparation
The raw materials are kept at 40 ℃. PPO, diamine chain extender and catalyst (component a) and u-MDI (component b) are mixed by 200g in a 50ml plastic beaker and poured into a mold with a Beder stirrer (1600r/min), the materials react quickly in the mold and are molded, the samples are taken out after 1-2 mins, the post-curing conditions are 120 ℃/30 min, and then maintained at 60℃ for 7 days.
1.3 DSC test
Du Pont 1090 thermal analyzer and its matching thermal analysis crucible were heated at -120~250℃ and temperature raise at 20℃/min in the N2 atmosphere, and the sample was ~10 mg.
2.Results and discussion
2.1 Kinetics and Thermal Analysis of Polymerization
Fig. 1 is a DSC spectrum of raw material. The main transition quantity of -62.3℃ in the PPO curve is T2 of cell [-(CH3)CH-CH2-O-].
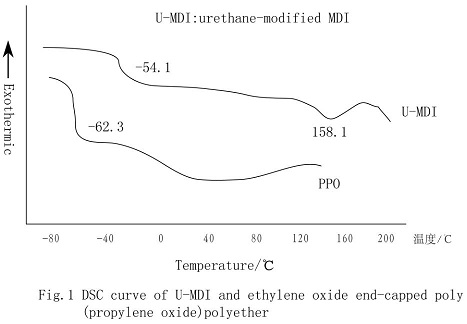
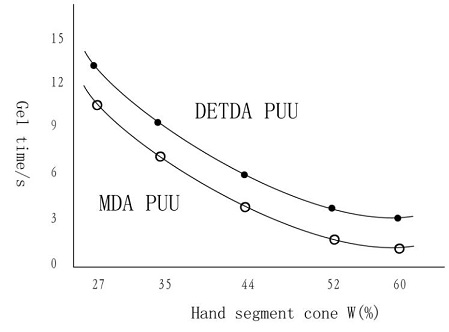
Fig.2 Relations of gel time and hard segment concentration of RIM polyurethane urea (PUU)
The results of fig. 2 show that RTM PUU polymerization is extremely fast.
As can be seen from fig. 3, MDA/PPO and Tga are significantly higher than DETDA / PPO
The difference between the two hard segment structures lies in the different chain extender structures (fig.4).
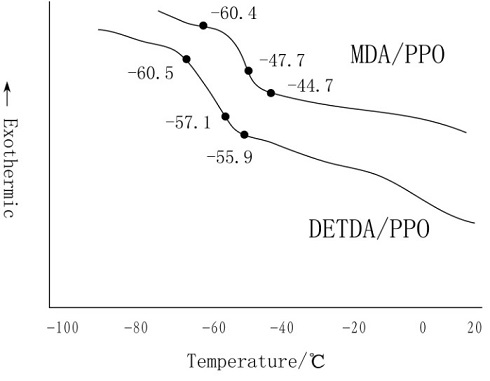
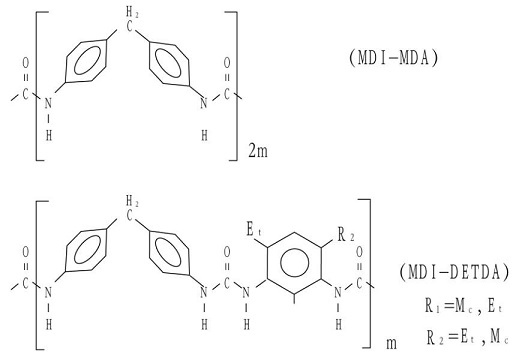
Fig.4 Hard segment structures formed by MDI reacting with MDA or DETDA
2.2 Thermal analysis below 0℃
In Table 1, ΔCps is heat capacity change of unit weighted pure soft segment at Tags, and ΔCp is heat capacity change of unit weighted RIM PUU at Tags; SR =ΔCp /Ws/ΔCps, in which Ws is weight fraction of soft segment in the copolymer.
Table1 Chemical composition and microphase separation characteristics in RIM polyurethane ureas
Sample No. | PPO:extender: U-MDI(molar ratio) | Whb(%) | ΔCp /mw·g-1 | SRa(%) | T‘1 /℃ | Tag /℃ | T1d/℃ |
D-27 | 1.0:0.54:1.54 | 27.1 | 0.118 | 96.9 | -48.0 | 42.2 | -36.1 |
D-35 | 1.0:1.21:1.21 | 35.4 | 9.49×10⁻² | 87.5 | -51.9 | 48.3 | -41.6 |
D-44 | 1.0:2.08:3.08 | 43.6 | 6.89×10⁻² | 73.7 | -47.8 | 42.6 | -37.9 |
D-52 | 1.0:3.23:4.23 | 51.8 | 5.29×10⁻² | 66.0 | -53.3 | 48.2 | -41.6 |
D-60 | 1.0:4.85:5.85 | 59.9 | 4.23×10⁻² | 63.4 | -50.1 | 40.8 | -29.1 |
M-28 | 1.0:0.42:1.42 | 27.6 | 0.109 | 90.7 | -45.0 | 45.0 | 39.3 |
M-35 | 1.0:0.95:1.95 | 35.4 | 9.43×10⁻² | 86.4 | -60.9 | 57.2 | -48.6 |
M-44 | 1.0:1.63:2.63 | 43.6 | 5.54×10⁻² | 59.3 | -50.4 | 45.4 | -39.6 |
M-52 | 1.0:2.54:3.54 | 51.8 | 3.54×10⁻² | 44.2 | -49.3 | 41.2 | -19.5 |
M-60 | 1.0:3.81:3.81 | 59.9 | -- | -- | -- | -- | -- |
a. D-: DETDA PUU.M-: MDA PUU; b. Wh: Hard segment cone; c.T1: Temperature at the starting point of Ta ; d. T: The temperature at the ending point of Ta.
2.3 Thermal analysis above 0℃
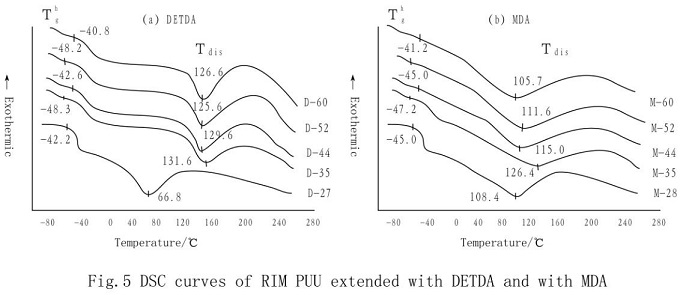
From the DSC spectra of MDA and de TDA chain-extended RIM PUU (fig.5), it can be seen that there is an endothermic process in the range of about 100℃ above room temperature, and the endothermic width of MDA series is wider than that of DETDA series.
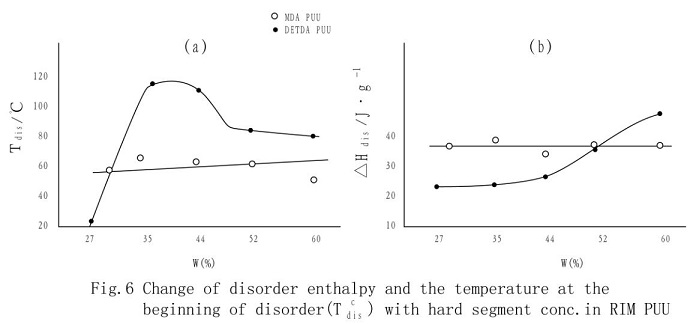
As can be seen from fig.5 and fig.6, de-sequencing temperature This, de-sequencing starting temperature TCdis and de-sequencing enthalpy ΔHdis of the PUU with MDA chain extension change just a little with the increase of Wh.
